
Startup stories are inspiring.
Seeing entrepreneurial dreams come to life is a rewarding experience for business owners and aspiring entrepreneurs alike.
But there are other stakeholders who find startup journeys compelling …
Investors and journalists.
Angel investors and other professionals with deep pockets love investing in and promoting early-stage entrepreneurs with promise.
And for good reason.
Startups don’t play safe.
They take bold risks — and when done strategically, these moves skyrocket success.
But success without proof is just talk. To put your money where your mouth is, investors and journalists want to see the facts.
And that’s where data visualization comes in.
Let’s take a closer look at what data visualization is, how to gather data for storytelling, and how to use data visualization to pitch to journalists and investors.
We’ll also review two bonus ways you can use data visualization to become more attractive to journalists and investors.
What is data visualization?
Data visualization is the graphical representation of information in a visual format, such as charts, graphs, and maps.
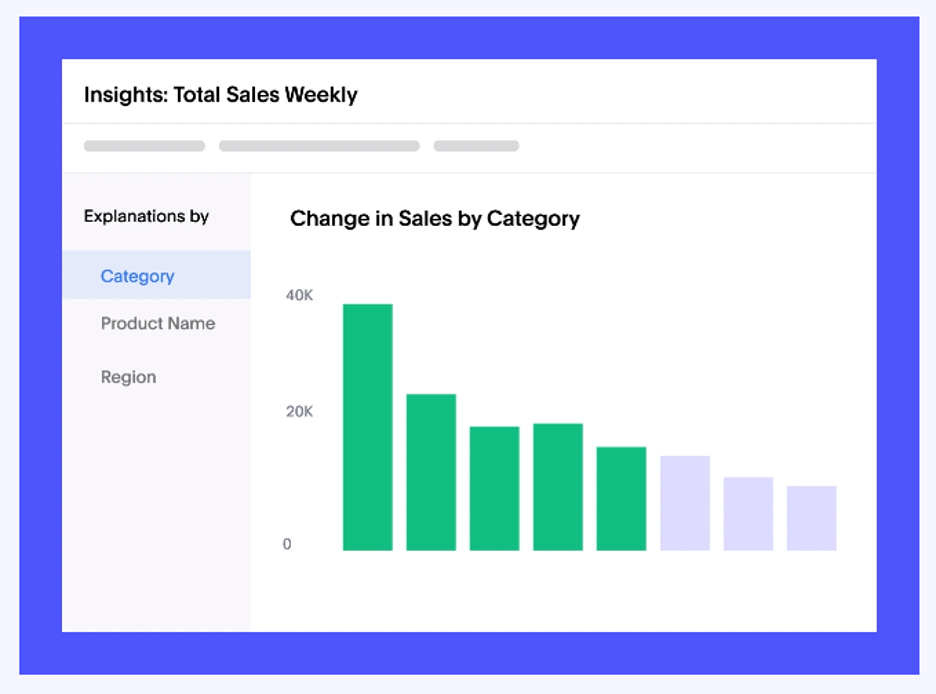
This helps businesses and marketers understand complex data sets and patterns.
As a startup, data visualization is a powerful tool that can provide valuable insights into your business.
It helps you present information in a clear and concise way, making it easier to identify trends, patterns, and correlations.
By visualizing your data, you can communicate key information to journalists, investors, and other important stakeholders.
This can help you better convey your entrepreneurial journey, including your:
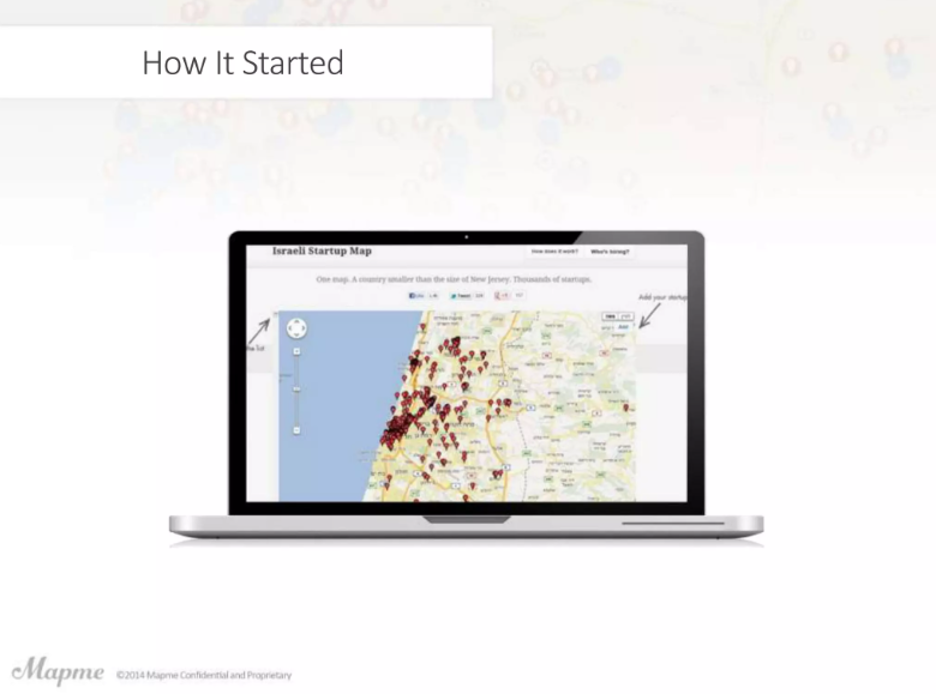
- Startup story: How you got started and where you’re going
- Sales performance: How much revenue you’ve earned so far
- Operational performance: How well your systems and processes are working
- Lead generation: How you generate leads
- Customer volume: How many customers you currently have, including individual segments
Whether it’s tracking sales performance, analyzing customer behavior, or monitoring market trends, data visualization can help you use data to better understand your industry and customers.
You can then turn these insights into compelling stories to win over journalists and investors.
What can I use to gather and visualize data?
Data visualization is a powerful way to convey your startup’s narrative to journalists and investors.
But you need tools to help you gather and integrate data.
You also need features to transform complex datasets into compelling visual narratives to highlight your venture’s growth, trends, and success metrics.
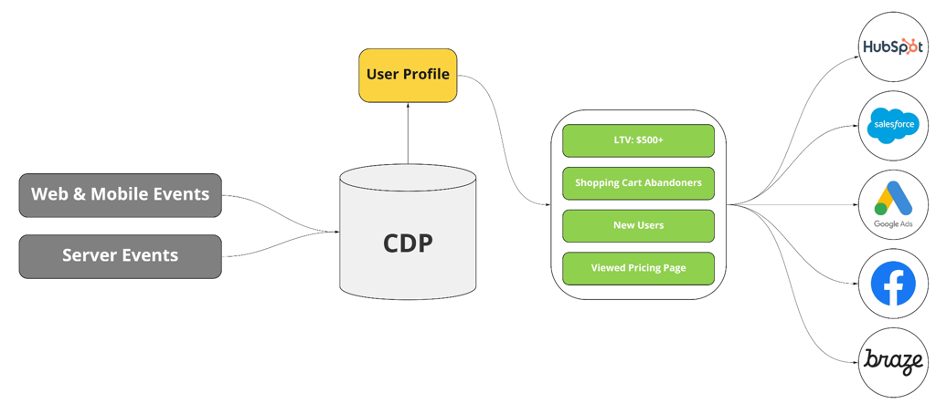
Using software like customer data platforms can elevate this process, seamlessly syncing your customer data from your warehouse directly into your CRM and marketing tools. This not only helps make sure your data is up-to-date and accurate but also helps you craft personalized, data-driven stories.
You can also use data intelligence tools to filter through complex data sets and gather ultra-granular details. There are several popular tools you can use, such as Power BI, but alternatives to Power BI are numerous, so take time to find the one that suits you best.
On these tools, for instance, you might use filters such as “sales,” “Q2,” “2023,” “subscription boxes,” and “anti-aging” to generate a report that shows how much revenue your business earned in Q2 of 2023 on anti-aging subscription boxes.
How to use data visualization to pitch to journalists and investors
When it comes to pitching your startup to journalists and investors, getting creative and demonstrating business value is key.
To generate interest and hold attention, you need a compelling pitch that stands out and showcases why your startup is worth their time and investment.
You can do this by incorporating storytelling and data visualization into your pitch deck.
Here’s how:
Start with your “why”
At the start of your deck, communicate why journalists and investors should care about your startup.
Highlight the specific problems your startup solves and why these issues matter in the industry.
By emphasizing your solution’s relevance and impact, you can capture their attention and convey the value your startup brings to the market.
Accompany your storytelling with visual data, such as product images, graphs, and charts and showcase your startup’s:
- Origination story
- Offers
- Objectives
- Current wins
- Traction
- Momentum
- Go-to-market strategy
By presenting data in a way that’s easy to understand, you can better demonstrate your startup’s growth potential and market viability.
Reveal the core financials
Investors are particularly interested in the financial aspect of your pitch.
Highlight the potential for recurring revenue and provide projections that showcase a high valuation in the future.
Use graphs and charts to paint a clear picture of your startup’s financial prospects and make a compelling case for why investors should consider funding your venture. (For instance, has Sam’s Club promised your startup one million dollars worth of orders each month for the first two years?)
Share how your business idea affects the public
Journalists are always on the lookout for stories that’ll captivate their readers and offer solutions to major consumer and business problems.
Clearly articulate how your startup is going to solve a critical issue that resonates with their audiences.
By demonstrating your startup’s social and economic impact and relevance, you can encourage journalists to spread the word about your new business.
Ask for the investment and press
Conclude your pitch with a formal ask.
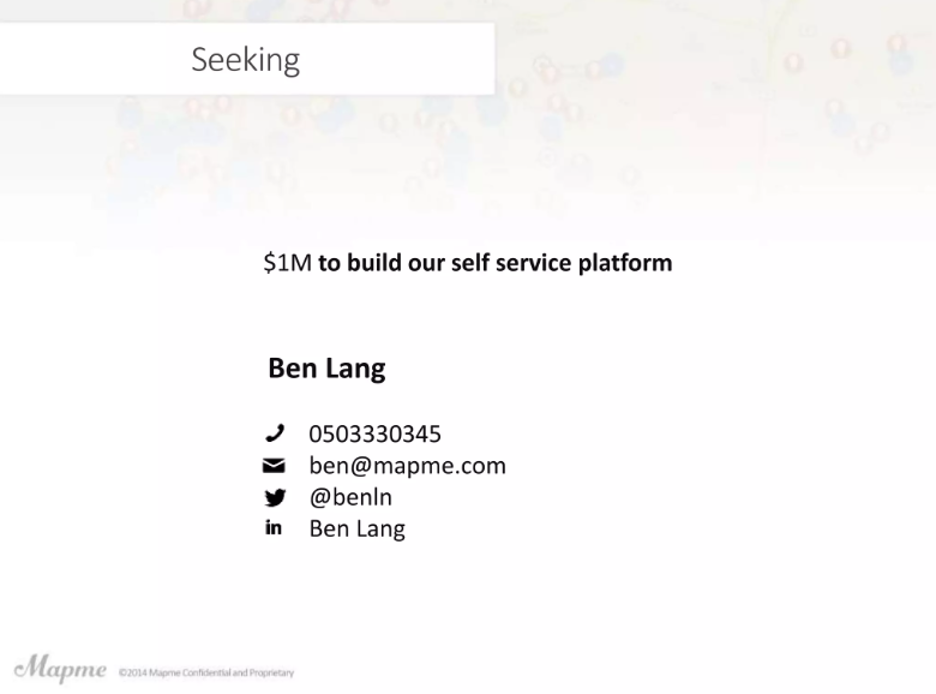
State how much funding and press you’re looking to raise and what specific milestones you plan to accomplish with each investment and PR announcement.
This demonstrates your strategic thinking and allows investors and journalists to see how their investment and marketing will contribute to your startup’s growth and success.
More ways startups can use data visualization
Let’s take a look at two bonus ways startups can use data visualization.
Implementing the following strategies can help your startup become more attractive to journalists and investors.
Optimize your sales strategies and operations
Data visualization provides rich insights you can use to uplevel everything about your startup, including your sales strategy and operational efficiency.
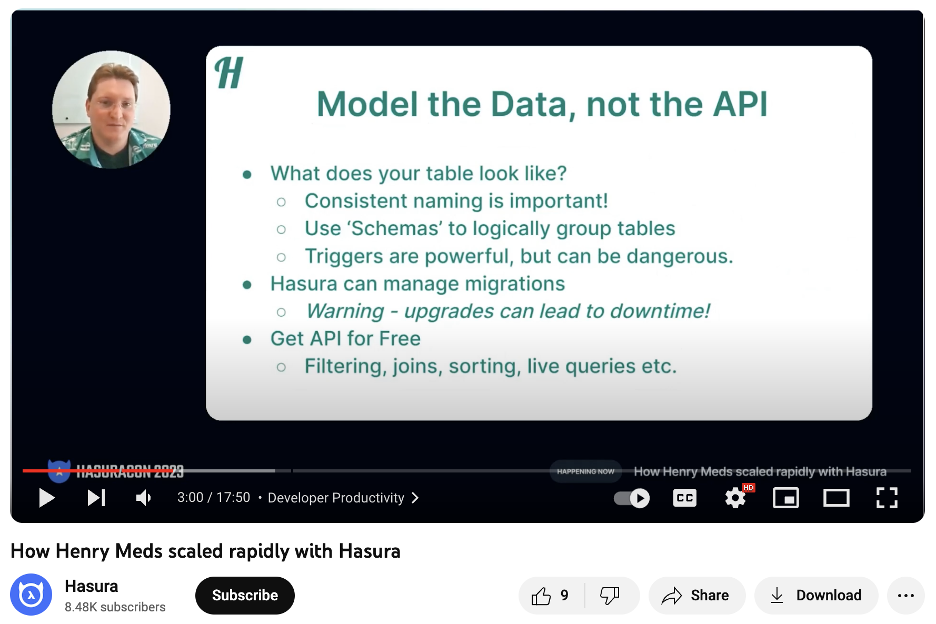
For instance, Henry Meds rapidly scaled its brand after using cutting-edge technology called Hasura, which transformed how it handles data visualization.

The tool has proven instrumental in helping Henry Meds streamline and accelerate its operations.
With Hasura, Henry Meds effortlessly connects data sources to get a unified view of critical healthcare and pharmaceutical information.
This integrated approach has optimized its data visualization, promoting real-time tracking and the ability to analyze key metrics, such as:
- Patient outcomes
- Prescription trends
- Inventory management
Another key strength of Hasura is its ability to generate APIs instantly — reducing the time and effort required for data integration.
This feature helps Henry Meds quickly create interactive dashboards and reports that offer insights into its healthcare services’ performance.
By analyzing the data, the brand has been able to make informed decisions to better serve its patients and optimize its operations.
The seamless integration with Hasura has also empowered Henry Meds to adapt to changing industry dynamics and evolving healthcare needs.
The brand can quickly respond to shifts in patient demand, regulatory requirements, and treatment trends with Hasura’s real-time data visualization features.
See where your competitors are falling short and adapt to evolving customer needs
Startups can also use data visualization and robust competitor analysis tools to get a closer look into their competitors’ strategies. Use rich insights to create a comprehensive competitive intelligence report and highlight key areas where your brand can fill in the gaps.
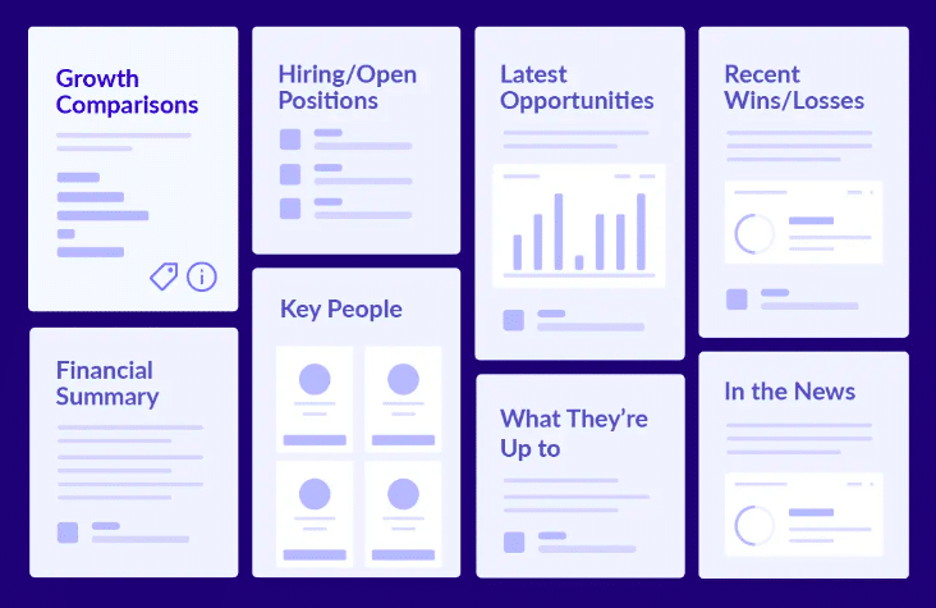
Visualizing key metrics, such as revenue growth, user acquisition, market share, and other KPIs, can help you analyze each competitor’s success.
After monitoring the data, create an action plan to help your brand become more competitive.
For instance, you might notice that your competitors are marketing to the Eastern European region and seeing a lot of success. If you haven’t approached that market segment yet, this might be a great opportunity to start.
Or, you might notice that your competitors offer quality tiered plans, but no options for customizing features. After analyzing feedback on popular review sites, you realize how important this is to small business owners who don’t need robust plans.
In this case, you could rework your plans with the option to add or remove features from any subscription.
Wrap up
Data visualization is an essential tool for startups interested in attracting investors and journalists.
While inspirational stories are important, stakeholders also want concrete evidence to showcase success and realistic growth projections.
By visualizing data with charts, graphs, and informative images, startups can provide solid proof of their potential, making their pitches more persuasive.
Startups can also use data visualization to track progress, optimize sales and operations, and perform competitor gap analyses.
Boost your chances of securing investments and media coverage by using compelling storytelling and visual data representations to win over stakeholders.
And if you need professional PR help …
Pressfarm is on your side.
Reach out for PR media support today.
Here’s to your success!
Author Bio:

Ioana Wilkinson
Ioana specializes in Business, Digital Marketing, and SaaS content for B2B brands. Born in Transylvania and raised in Texas, Ioana has been living the digital nomad life since 2016. From Barcelona to Puerto Vallarta to her new abode in windy Oklahoma City, you’ll never know where Ioana will head off next.